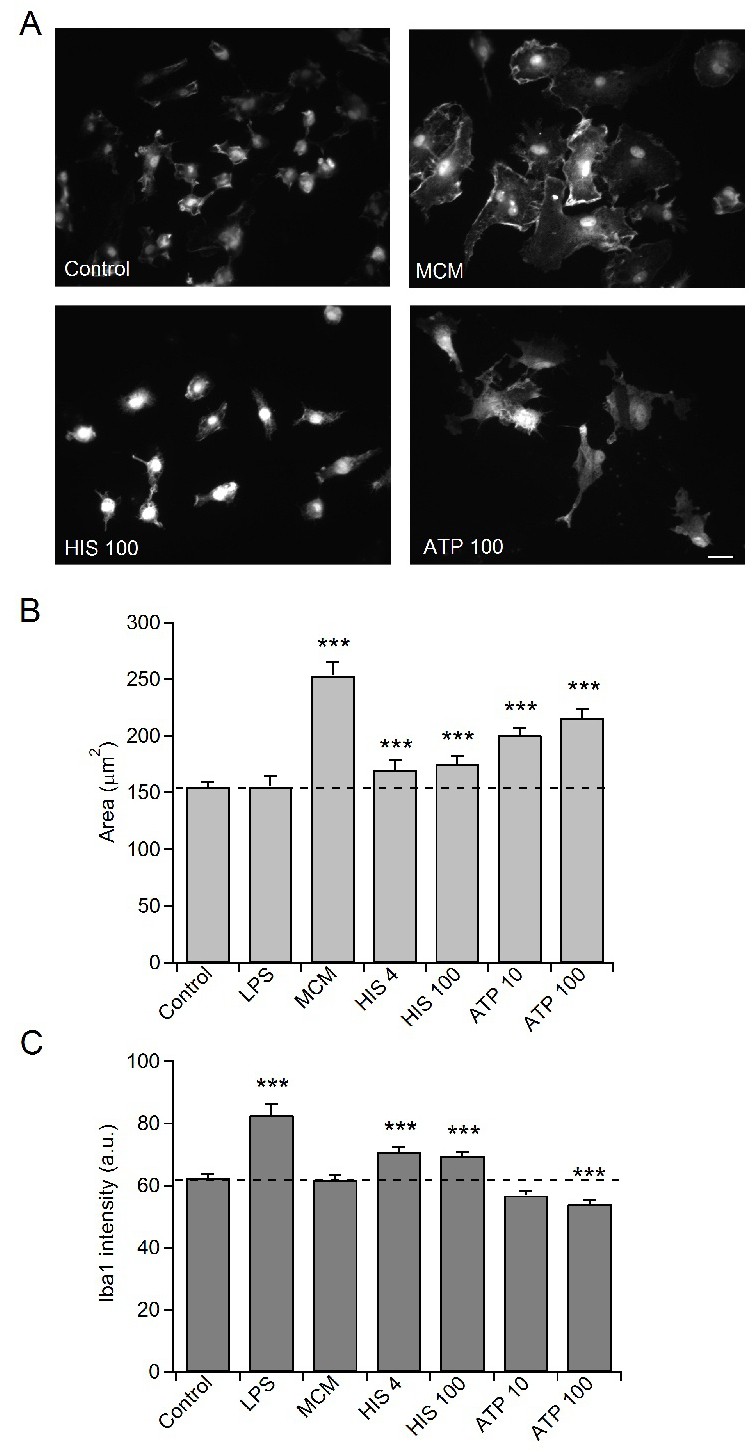
Fig. 5. MCM increases area but does not modify iba-1 expression in microglia. A) Representative images of iba1-positive microglia cells in non-treated cells (control), cells treated with MCM (MCM), histamine 100 µM (HIS 4) and ATP 100 µM (ATP 100). B) Surface area of cells treated for 48 h with MCM, histamine 4 µM (HIS 4), histamine 100 µM (HIS 100), ATP 10 µM (ATP 10), ATP 100 µM (ATP 100) and LPS 1 µg/ml (LPS). C) Iba1 fluorescence intensity in cells treated for 48 h with MCM, HIS 4, HIS 100, ATP 100 and LPS. Values (mean ± S.E.M) were computed from four independent culturing experiments. ***p<0.001, using the Mann-Whitney Rank Sum test. Scale bar 10 µm.